Fractals
Everyone likes to plot formulas, me included. I drew these Julia and Mandelbrot sets many years ago with SageMath, with the exponent as a slider.
Images
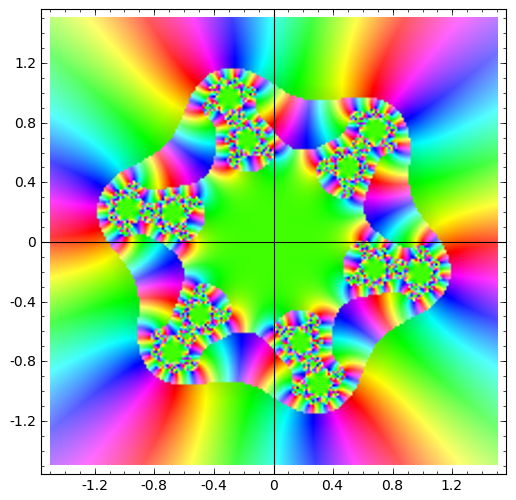
julia_plot(6, 30, -0.3, 1.1, (-1.5,1.5), (-1.5,1.5))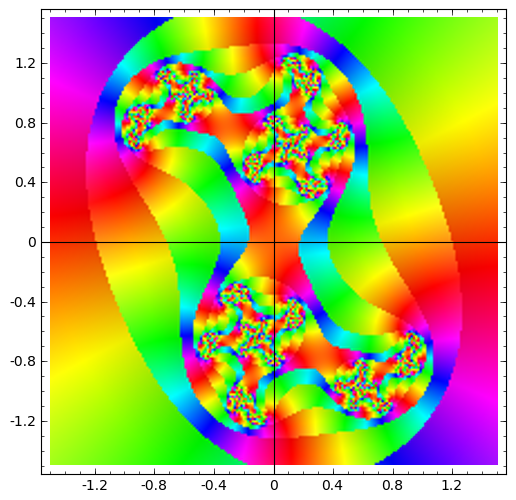
julia_plot(2, 30, 0.5, 0.5, (-1.5,1.5), (-1.5,1.5))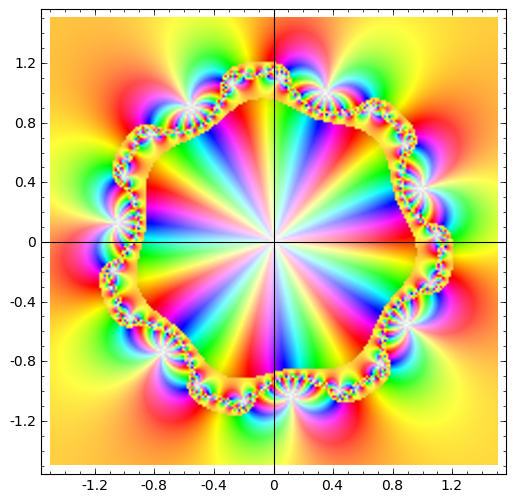
julia_plot(-7, 30, 0.5, 0.5, (-1.5,1.5), (-1.5,1.5))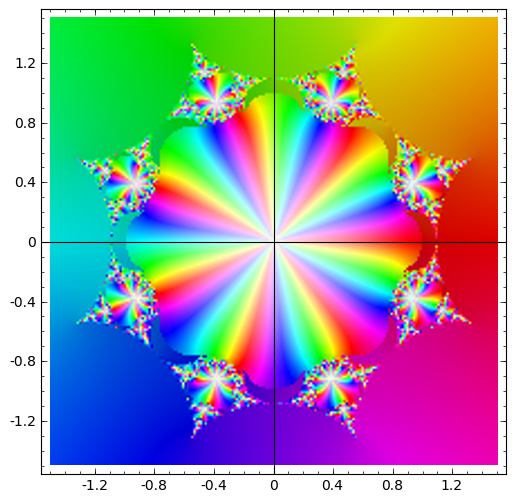
mandel_plot(-7, 'mandel', 40, (-1.5,1.5), (-1.5,1.5))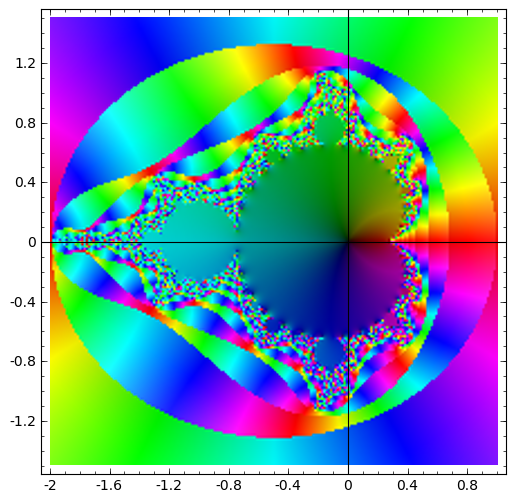
mandel_plot(2, 'mandel', 40, (-2,1), (-1.5,1.5))The code
Historic: Sage code from around 2010, still Python 2 (print without parentheses). It needs changes to run in a current Sage.
Julia
@interact
def julia_plot(expo = slider(-10,10,0.1,2), \
      iterations=slider(1,100,1,30), \
      c_real = slider(-2,2,0.01,0.5), \
      c_imag = slider(-2,2,0.01,0.5), \
      zoom_x = range_slider(-2,2,0.01,(-1.5,1.5)), \
      zoom_y = range_slider(-2,2,0.01,(-1.5,1.5))):
    var('z')
    I = CDF.gen()

    f(z) = z^expo + c_real + c_imag*I
    ff_j = fast_callable(f, vars=[z], domain=CDF)

    def julia(z):
      for i in range(iterations):
         z = ff_j(z)
         if abs(z) > 2:
            return z
      return z

    print 'z <- z^%s + (%s+%s*I)' % (expo, c_real, c_imag)

    complex_plot(julia, zoom_x,zoom_y, plot_points=200, dpi=100).show(frame=True, aspect_ratio=1)
Mandelbrot
@interact
def mandel_plot(expo = slider(-10,10,0.1,2), \
      formula = list(['mandel','ff']),\
      iterations=slider(1,100,1,30), \
      zoom_x = range_slider(-2,2,0.01,(-2,1)), \
      zoom_y = range_slider(-2,2,0.01,(-1.5,1.5))):
    var('z c')
    f(z,c) = z^expo + c
    ff_m = fast_callable(f, vars=[z,c], domain=CDF)

    # messing around with fast_callable
    for i in range(int(iterations)/3):
        f(z,c) = f(z,c)^expo+c
    ff = fast_callable(f, vars=[z,c], domain=CDF)

    def mandel(z):
      c = z
      for i in range(iterations):
         z = ff_m(z,c)
         if abs(z) > 2:
            return z
      return z

    print 'z <- z^%s + c' % expo

    # calling ff three times, otherwise it fast_callable exceeds a recursion limit
    if formula is 'ff':
        func = lambda z: ff(ff(ff(z,z),z),z)
    elif formula is 'mandel':
        func = mandel

    complex_plot(func, zoom_x,zoom_y, plot_points=200, dpi=100).show(frame=True, aspect_ratio=1)